FEAST Capabilities
Post Processor

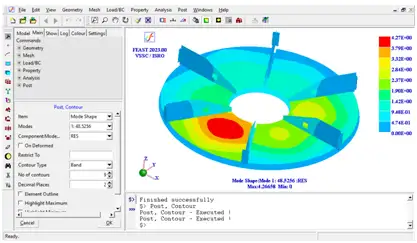
Multiple ways of visualising analysis results:
- Deformed geometry and contour
- Animation
- X-Y plot (linear, semi-log, log-log) in many documentation standard picture formats
- Vector plot
- Tabulated display: easily transferable to spread sheet applications of standard office suites